Product development: Product Life Cycle, Death Valley Curve, Marginal Utility
The three marketing tools presented in this article are truly practical. Understanding the concepts of Product Life Cycle, Death Valley Curve and Marginal Utility can help you anticipating market reactions and develop your marketing strategies' efficiency.
Product Life Cycle: the theory
Each product is unique, but all products follow the same pattern: the Product Life Cycle.
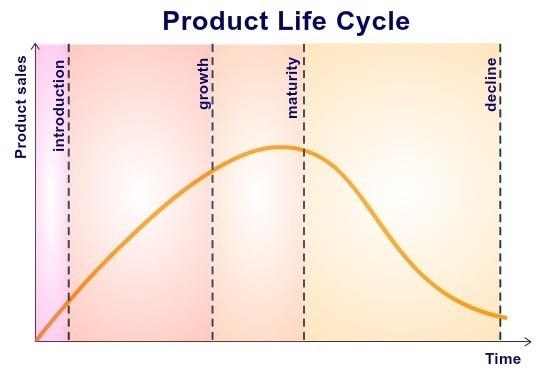
The Product Life Cycle concept states that a product life can be partitioned in four different periods:
- introduction
- growth
- maturity
- decline
The introduction corresponds to the time you introduce your new product to the market. Your market research should help you anticipate the actual result of such introduction.
The growth is a really variable period. Some products will just fail immediately, in which case there will be no growth period. Some will have a very long growth. The growth is the period during which the product sales and product fame will grow. This time isn't a pure growing time: you can have up and downs, but the overall curve is positive.
The maturity is the upper your product could go. This is the top of the curve, where the product is at the top of its fame and sales. This is the most you could get out of your product before its success starts fainting. When you feel this time coming, you must be able to react and adapt your strategy.
The decline is the end of your product's life. It has passed its maturity and slowly declines toward its end. Some companies will try to slow this process down hoping for a sudden return to the maturity phase: all products will decline sooner or later, this is just a matter of time. Anticipate this phase and move on to your next product to avoid wasting time and efforts on hopeless strategies.
Product Life Cycle: concrete examples
Coca-Cola's life cycle is in its growth phase for over two decades. Sales are going up and down depending on seasons, promotions, competition, but the overall trend of the item shows that it belongs to the growing phase.
iPad first generation was developed by Apple. The product was new to the market and its introduction in April 2010 turned very quickly to a growth (300 000 pieces sold on the first day). Very soon after the release, iPad could see competitors growing everywhere, taking up to 25% of the market share. Apple knowing the Product Life Cycle anticipated the maturity and decline of its product, rushed by the increasing competition and the technological breakthrough. In March 2011, before entering the decline stage, Apple decides to give up the iPad and introduces iPad2. The introduction of the new product cuts the Product Life Cycle of iPad in its maturity phase, saving the costs of holding a product in decline.
This strategy is the right strategy. It doesn't easily apply to all kinds of product and all situations, but ideally, that is the model you must look for: keep the Product Life Cycle curve in mind, estimate your product current position on it, anticipate the next move and plan the right time to abandon it and move forward to your next step.
Such strategy requires a lot of anticipation as you must be developing and investing in your next generation or your next item while getting the benefits of the current one.
Death Valley Curve: the theory
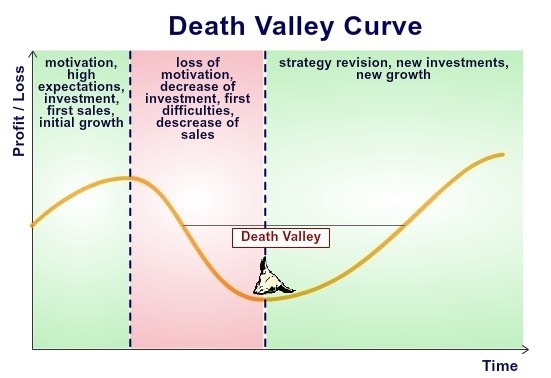
The Death Valley Curve is a concept that can easily be applied to companies, individuals, or even products. This marketing theory states that after the initial motivation, efforts, investment, sales... things usually tend to go down.
If you are wondering what is the difference between the Product Life Cycle and the Death Valley Curve concepts and which one to use, here is how to see things: the Death Valley Curve is like a zoom on the second stage of the Product Life Cycle, growth.
When launching a product, you put all your efforts and time in this product and its promotion. As a reaction, you usually have a nice start with good results and high sales. This corresponds to the "introduction" phase and the early stage of the "growth" stage.
Then, your initial motivation, investment, promotion, results, start fading. Your sales are dropping and you see the situation taking a dangerous path. This loss of motivation and difficult situation is typical of the Death Valley Curve: a sudden drop not long after the initial start putting the entire project in the balance.
Looking at the Death Valley Curve is a good way to see the whole picture of your current situation. Once you identified yourself being in such situation, you can fight back, come up with an adapted strategy and get out of this valley back to the mountains of success.
This situation usually occurs in the early stage of the growth and can block the process of product development: you must know this concept and identify it as early as possible.
The name of "Death Valley" isn't randomly chosen: if you do not manage to get quickly out of there you risk to kill your product.
The best solution to avoid this situation is a careful-thought-through strategy: your product launch strategy shouldn't be a huge starting promotion followed by nothing. It is important that you spread your efforts and plan the future to avoid seeing yourself wandering in the valley of death.
Death Valley Curve: concrete example
Last week, you had a great idea. You decided to create your own website. You started investing all your time and efforts into this piece of art. After a few days, the site was up and running. You started by spamming all your friends, texting your family and calling your mom to let them know about your new website. Statistics were amazing: 200 visitors on the first day!
But the enthusiasm passed, you had no more ideas or motivation to bring your website to the next level. Your job started to need you working later at night, and you slowly left your website behind. After a few days, you received no more than 2 or 3 hits a day: welcome to the death valley.
This is a very concrete example of what the death valley is: you put all your efforts and time in a project but this project then slides down the curve as resources disappear.
Creating a product is a constant effort and your initial kick can't last for long: this is for you to carry your project all the way to the top of the Product Life Cycle graph, and for this, you will need to identify and go through the death valley.
Marginal Utility: the theory
If the Death Valley Curve is a zoom on the early stage of the Product growth, the Marginal Utility is more like a zoom on the customer aspect.
The Product Life Cycle focuses on the product itself. The Marginal Utility studies the behavior of the consumer with this product.
As you read this sentence, you might think "this is the exact same thing!". Those things are dramatically different.
The Product Life Cycle studies the product's life as a whole. The Marginal Utility shows how a single consumer treats your product and helps relativizing the product's life understanding.
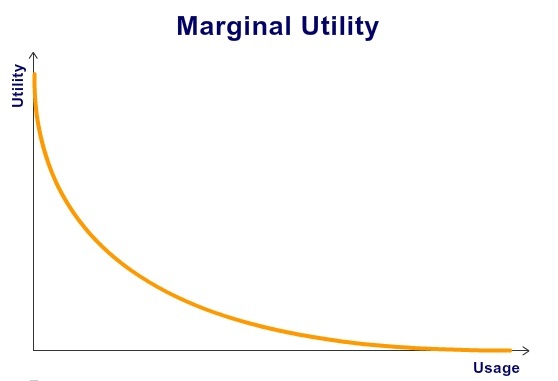
The Marginal Utility graph explains that a product's utility decreases with its usage. The more you make use of a product, the less utility this one shows to you. Once reaching the point of satiety, this utility becomes negative.
This is radically different from the Product Life Cycle as each consumer has a different Marginal Utility: consumer Alpha might reach a negative marginal utility long before the product arrives in the decline stage.
Marginal Utility: concrete examples
A very simple example of the Marginal Utility is the Ice Cream example.
Take an Ice Cream on a hot day: the first mouth will be extremely refreshing and exciting.
The second mouth will be very good, but less than the first one.
At each mouth, the Utility will decrease: this drop is called the Marginal Utility.
After finishing two Ice Creams, you might be full, reaching your satiety point. If you go further, the Ice Cream will make you sick, reaching a negative level of utility.
Each individual reaches his satiety point at a different time and it is difficult to estimate precisely such timing. However, a rough estimation of your product's average satiety point informs you on a micro-aspect of your Product Life Cycle: how long a single individual would use your product before getting tired of it. Knowing that, you can plan your promotional strategies and messages accordingly.
Preparing a good marketing strategy
Now that you know about those three concepts and understand their respective use, you must combine them to create your own marketing strategy.
Once you decided to launch a product, look first into the Death Valley Curve: the only way to avoid having your product in this valley two months after its launch is to plan ahead. Make sure your strategy covers at least 6 months, and not only the launch itself. Make sure your strategy considers the possibility that your product would go down the curve and has solutions to push it back up. After the launch, keep an eye on your sales, compare it to your forecast and estimate your position on the curve to react as efficiently as possible.
Then, look into the Marginal Utility chart and estimate your typical customer's curve. How fast does your product's utility decrease? What is the pattern of repurchase of your customers? Answering those questions will help you creating a sales forecast and estimating your Product Life Cycle.
Finally, immediately after the launch of your product, keep an eye on the Product Life Cycle. You must be able to estimate your position on this curve at all time in order to adapt your strategy and avoid any money waste.
You are now ready to launch your new product and to monitor its progress ("Product development case study: How-Old.net, how Microsoft test a product on a large scale with small budget").
To go even further and learn other marketing concepts, I invite you to read my article "NPS, a very useful tool to analyze your customer's loyalty".
Last update: 2012-05-13 Tags: death valley marginal utility product life cycle product life marketing concepts product cycle iPad coca iPad case study
 Entrepreneur, CMO international et Professionnel Certifié en Expérience Client (CCXP), j'ai passé ces 16 dernières années à piloter la croissance et la stratégie marketing d'entreprises en Europe et en Asie.
Tout au long de ma carrière, j'ai dirigé des équipes mondiales avec un focus sur le branding et la génération de demande, tout en fondant myfairtool, en publiant deux ouvrages de référence, en animant des podcasts marketing et en développant le RIO Integrated Marketing Campaign Framework.
Sur ce blog, je partage mes méthodes, mes connaissances et mon expérience. N'hésitez pas à me contacter si vous souhaitez mon expertise sur des projets spécifiques.
Julien Rio.


 Français
 English